Python offers extensive libraries like Pandas, NumPy, and Matplotlib that streamline the data cleaning, manipulation, and visualization process in data analysis. R provides specialized statistical packages and excels in advanced statistical modeling, making it a preferred choice for researchers and statisticians. Both languages integrate well with big data tools, but Python's versatility extends beyond data science, whereas R remains focused on statistical computing.
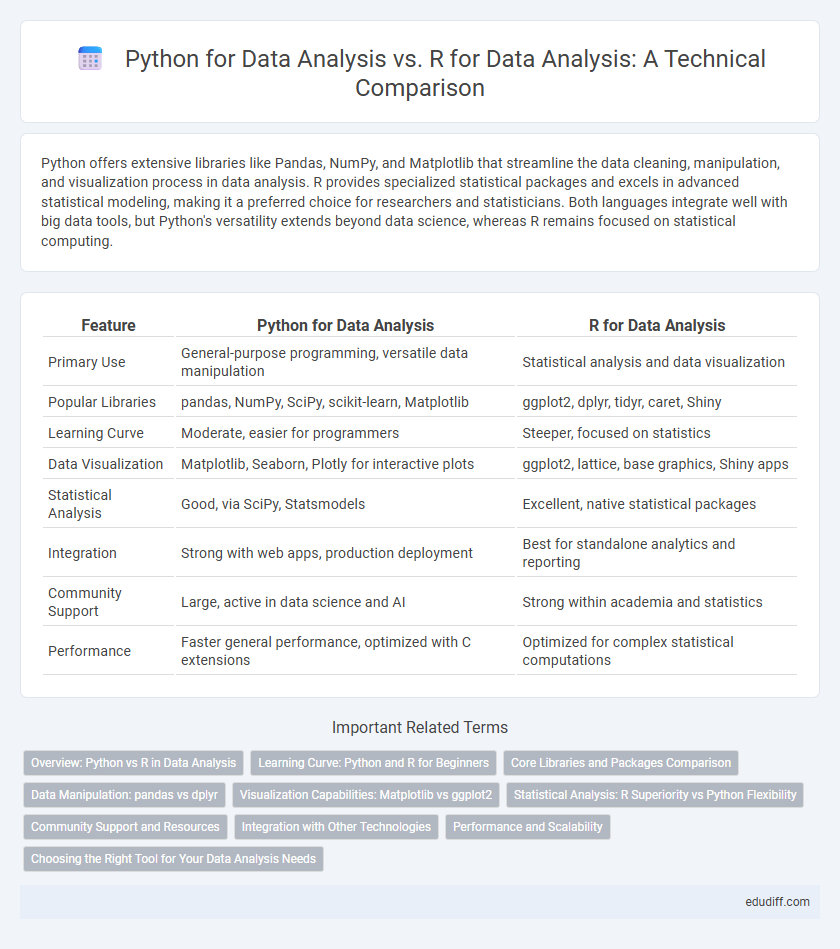
Table of Comparison
| Feature | Python for Data Analysis | R for Data Analysis |
|---|---|---|
| Primary Use | General-purpose programming, versatile data manipulation | Statistical analysis and data visualization |
| Popular Libraries | pandas, NumPy, SciPy, scikit-learn, Matplotlib | ggplot2, dplyr, tidyr, caret, Shiny |
| Learning Curve | Moderate, easier for programmers | Steeper, focused on statistics |
| Data Visualization | Matplotlib, Seaborn, Plotly for interactive plots | ggplot2, lattice, base graphics, Shiny apps |
| Statistical Analysis | Good, via SciPy, Statsmodels | Excellent, native statistical packages |
| Integration | Strong with web apps, production deployment | Best for standalone analytics and reporting |
| Community Support | Large, active in data science and AI | Strong within academia and statistics |
| Performance | Faster general performance, optimized with C extensions | Optimized for complex statistical computations |
Overview: Python vs R in Data Analysis
Python and R are both powerful languages for data analysis, with Python offering extensive libraries like Pandas, NumPy, and Matplotlib that support versatile data manipulation and visualization tasks. R excels in statistical analysis and graphical models, featuring packages such as ggplot2, dplyr, and Shiny for advanced statistical computing and interactive visualizations. Python's integration with machine learning frameworks like TensorFlow and scikit-learn contrasts with R's strength in specialized statistical techniques, making each suitable for different analytic requirements.
Learning Curve: Python and R for Beginners
Python offers a gentler learning curve for beginners in data analysis due to its straightforward syntax and extensive libraries like Pandas and NumPy. R, while powerful in statistical analysis and visualization with packages such as ggplot2 and dplyr, presents a steeper learning curve because of its specialized language structure. Both languages provide robust community support, but Python's versatility across various programming domains makes it more accessible for newcomers.
Core Libraries and Packages Comparison
Python's core libraries for data analysis include pandas for data manipulation, NumPy for numerical operations, and Matplotlib for visualization, offering a broad ecosystem that integrates well with machine learning frameworks like TensorFlow and Scikit-learn. R specializes in statistical analysis with packages like dplyr for data manipulation, ggplot2 for advanced visualization, and caret for machine learning, emphasizing statistical rigor and domain-specific analytics. Both languages excel in data analysis but cater to different user preferences: Python prioritizes versatility and integration, while R emphasizes statistical methods and specialized packages.
Data Manipulation: pandas vs dplyr
Pandas in Python offers comprehensive data manipulation capabilities with its DataFrame structure, enabling efficient data cleaning, transformation, and aggregation through intuitive functions like merge, groupby, and pivot_table. In contrast, dplyr in R provides a streamlined grammar of data manipulation using verbs such as filter, select, mutate, and summarize that facilitate pipeline-friendly data handling within the tidyverse ecosystem. While pandas excels in handling large datasets with extensive compatibility in machine learning workflows, dplyr's syntax emphasizes readability and integrates seamlessly with other R packages for statistical analysis.
Visualization Capabilities: Matplotlib vs ggplot2
Matplotlib in Python offers extensive customization and fine control over complex visualizations, making it ideal for detailed, publication-quality graphics in data analysis. In comparison, R's ggplot2 excels in declarative, layered grammar for creating aesthetically pleasing and statistically insightful visualizations with less code. While Matplotlib integrates seamlessly with Python's data manipulation libraries like pandas, ggplot2 is deeply embedded within the R ecosystem, enhancing statistical plotting and exploratory data analysis.
Statistical Analysis: R Superiority vs Python Flexibility
R excels in statistical analysis due to its extensive collection of specialized packages like ggplot2, dplyr, and caret, which offer advanced statistical modeling and visualization capabilities tailored for complex data sets. Python provides greater flexibility with libraries such as pandas, NumPy, and scikit-learn, supporting a wide range of data manipulation and machine learning tasks beyond traditional statistics. While R is preferred for deep statistical research and hypothesis testing, Python's versatility makes it ideal for integrating statistical analysis into broader data science workflows.
Community Support and Resources
Python for data analysis benefits from a vast and diverse community with extensive libraries like pandas, NumPy, and scikit-learn, ensuring continuous updates and comprehensive tutorials. R offers a specialized community with strong support in statistical analysis and visualization through packages such as ggplot2 and dplyr, backed by academic and research institutions. Both languages provide rich resources, but Python's broader application scope attracts a larger, more varied user base for collaborative problem-solving and resource sharing.
Integration with Other Technologies
Python for data analysis seamlessly integrates with a broad ecosystem of technologies, including machine learning libraries like TensorFlow and scikit-learn, web frameworks such as Flask and Django, and big data tools like Apache Spark and Hadoop. R offers strong integration with statistical tools and specialized data visualization packages like ggplot2 while also supporting connections to databases and APIs through packages like DBI and httr. Both Python and R facilitate interoperability with cloud platforms and support containerization, enhancing their utility in production environments.
Performance and Scalability
Python for data analysis offers robust performance with libraries like NumPy and pandas optimized for large datasets, providing efficient memory management and fast execution. R excels in statistical computing with specialized packages like data.table and dplyr, enabling high performance in complex data manipulation and analysis tasks. Scalability in Python benefits from integration with big data tools such as Apache Spark and Dask, whereas R's scalability is enhanced through parallel processing and integration with cloud computing environments.
Choosing the Right Tool for Your Data Analysis Needs
Python offers extensive libraries like pandas, NumPy, and scikit-learn well-suited for complex data manipulation and machine learning tasks, making it ideal for integrating data analysis within broader software development projects. R excels in statistical modeling and visualization with specialized packages such as ggplot2 and dplyr, preferred by statisticians for rigorous data analysis and research. Selecting the right tool depends on project requirements, with Python favored for versatility and integration, while R is optimal for advanced statistics and exploratory data analysis.
Python for Data Analysis vs R for Data Analysis Infographic